SandboxAQ’s AI drug discovery platform uses machine learning and physics-based simulation to predict how molecules will bind, behave, and perform as drugs before lab testing. We help teams screen millions of compounds computationally, prioritize the most promising candidates, and de-risk hard-to-drug targets faster than traditional wet-lab-first pipelines. Our tech-enabled services bring the same frontier science to work on your program and deliver evidence-backed decisions you can trust.




Every downstream dollar depends on your target choice. Much of the AI effort in drug discovery goes to finding and designing molecules, where large chemistry and structure datasets exist. The harder problem is evidence that a target causes disease rather than merely correlates with it. We help you build that evidence.
Public target databases reflect past research trends, not unexamined biology. Our knowledge graph unifies published literature and your own data, with the source behind every link. In our Parkinson’s graph (222,000 nodes, 6.7 million edges), known disease genes ranked at the top: UCHL1 first, SNCA fourth, LRRK2 seventh.
Ranked target lists are only useful when scientists can audit why each target appears. Every answer links back to graph paths and source papers.
Our scientists test the graph’s ranking against known targets, then package each prioritized hypothesis in a dossier. We help your team move from that dossier to experimental validation.
Our Parkinson’s graph joins 15 public databases with proteomic, transcriptomic, clinical and GWAS data into 222,000 nodes and 6.7 million edges, and it recovers known Parkinson’s targets. A graph ranks hypotheses; laboratory experiments confirm them.
Deliverables
Typical length 8 weeks to 6 months
End-to-End Knowledge Workflow for Target Discovery
Ingest
AQKG
Optimize
Graph curation
Benchmark
Known targets
LLM Interface
Ariadne-style Q&A
Deploy
Client environment
Prioritized Hypotheses
Dossiers
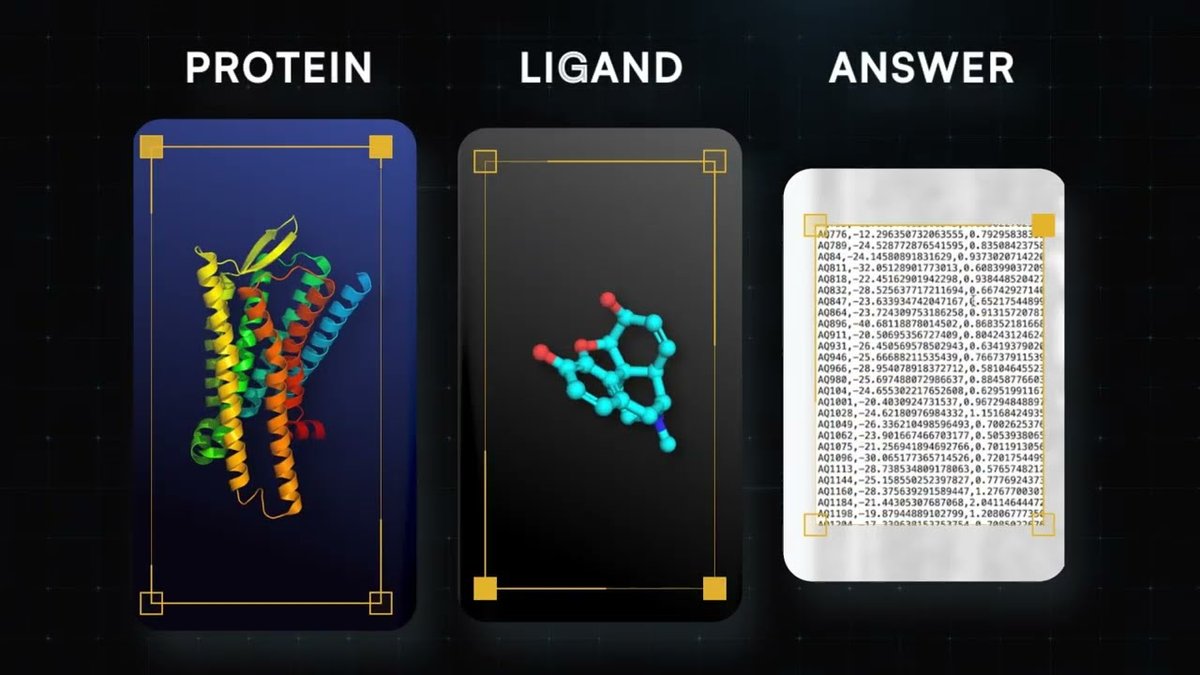
Screening no longer has to wait for expensive structure work. Many targets have no reliable 3D structure, and obtaining one takes time and money. We have a model which doesn’t require a 3D structure for potency prediction and virtual screening. It scores about 2,000 protein-ligand pairs in 15 seconds, much faster and at much lower cost than structure-based methods. In benchmark testing, its early rankings were statistically equivalent to physics-based docking. All it needs is the target’s UniProt ID and the compounds’ SMILES strings.
Start with a compound that shows a useful effect, and find the proteins it is most likely to hit. We scan it across the proteome and rank every protein by predicted potency and likelihood of activity. Each target also gets a score for how well the prediction fits the data the model knows. Your team gets a short list of targets to test first.
Screening against one target is not enough. Our model, AQPotency, also scores compounds against whole families of related proteins, such as kinases, and against standard safety panels. Your team sees early which compounds look effective and are least likely to hit the wrong proteins.
Predictions are most reliable for compounds that resemble the model’s training data. Every compound comes back with its predicted potency, its likelihood of activity and a 0–1 score for how well it fits what the model has seen. Low-scoring compounds are flagged separately. Your team can then decide which ones to verify in the assay before docking or synthesis.
Execute first-pass library rankings at scale before committing structural or wet-lab capacity.
AQPotency is a Large Quantitative Model for potency prediction and virtual screening that ranks protein-ligand pairs by predicted binding strength (pIC50) without requiring a 3D structure of the target.
Bring AQPotency into your own enterprise environment, and/or finetune the model on your own data.
AQPotency is a Large Quantitative Model for potency prediction and virtual screening that ranks protein-ligand pairs by predicted binding strength (pIC50) without requiring a 3D structure of the target.
When targets resist standard screening due to missing structures, aggregation, or complex assembly requirements, our team runs custom physics-based workflows alongside your researchers.
Deliverables
Hit-Finding Campaign Workflow: target to ranked buy/make list
Scope and Baseline
Target, assay, budget
Generate or Screen
AQGenlibrary screen
Potency Triage
AQPotency
Physics Re-rank
AQFEPTAQOAQNEX
ADME Flags
AQADME
Buy/Make List
Med-chem review
We help teams find and remove liabilities before they make the compound. Lead optimization is where problems are cheapest to fix. Teams must improve potency while keeping selectivity, exposure and safety in balance. Our models flag risks such as off-target activity while a compound is still only a design, so chemists can focus on the compounds most likely to become a development candidate.
Fast models can screen every analog you propose. Physics-based methods rank close relatives better, but they cost too much to run on everything. So we use each where it counts. Fast models narrow the list, and physics sets the final order for the compounds that matter most.
Our models score a full panel of targets in the same pass as the main target, with no 3D structure needed. Off-target risks show up before synthesis. Each compound also gets a 0–1 score for how well it fits the data the model knows. Your team can see which flags to trust and which to confirm in the assay.
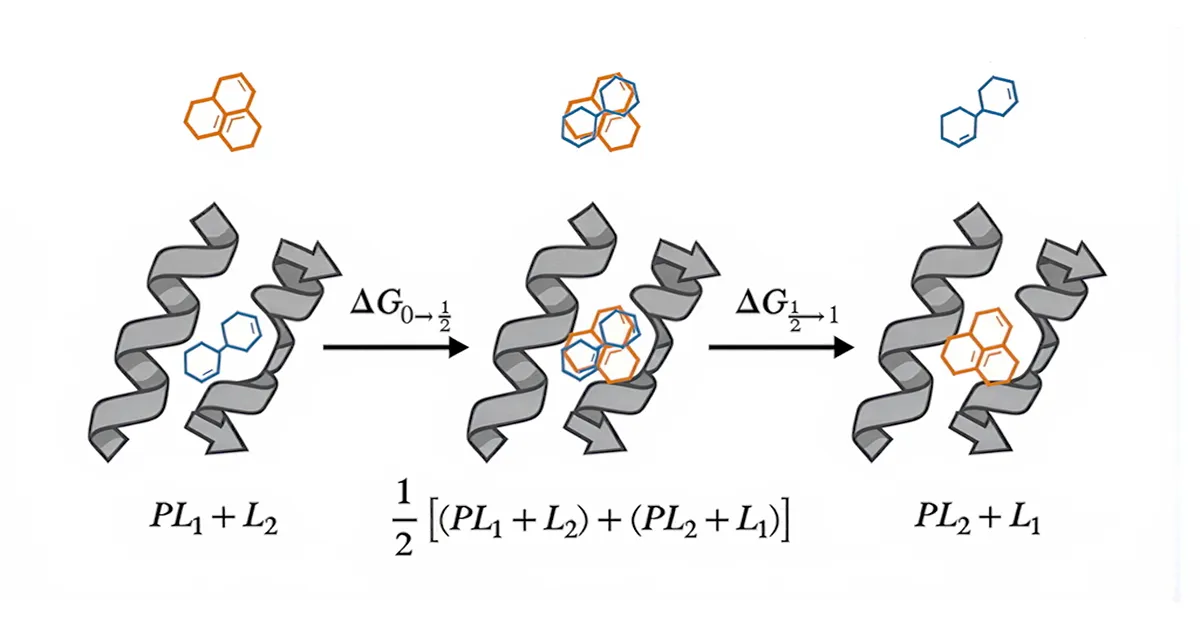
Free-energy calculations often fail when two compounds look very different. Our NEX method adds a blended intermediate between them, which keeps the calculation stable. In a CDK2 comparison at equal compute, failures fell from 16% to 2% or below. That gives your team usable answers where the design changes are largest.
Score every analog on your design list, and every off-target it might hit, before you commit a free-energy run or a synthesis slot.
AQPotency is a Large Quantitative Model for potency prediction and virtual screening that ranks protein-ligand pairs by predicted pIC50 without requiring a 3D crystal structure of the target. In lead optimization, the method can also be fine tuned on proprietary data via AWS sagemaker and can be used to triage enumerated analogs and to profile selectivity across target panels, then hand the shortlist to free-energy methods for the final ordering.
Your own series data is the best training set for the next round of analogs. Bring AQPotency into your own enterprise environment, and/or fine-tune the model on your own assay data.
AQPotency is a Large Quantitative Model for potency prediction and virtual screening that ranks protein-ligand pairs by predicted binding strength (pIC50) without requiring a 3D crystal structure of the target.
The best next compound often has no close relative to compare it with. Free-energy methods rank close analogs well but cost too much to run on everything, and fast scorers that run on everything still trail them at that job, although they run about 400,000 times faster. We chain the two: fast models triage every analog the chemists propose, and physics re-ranks the shortlist.
For scaffold hops, we are previewing NEX, our nonequilibrium chimeric switching method. At equal compute on a CDK2 test, direct switching failed on 16% of transformations; with NEX, failures fell to 2% or below. On a 45-transformation BACE1 scaffold-hopping set run without manual tuning, NEX reached r = 0.71 against experiment. We aim to bring that stability to every series we run.
Deliverables
Typical length 4–6 months, across several design cycles
DMTA Optimization Workflow
Ingest Assay Data
Client or CRO data
Design
AQGenenumeration
Rank
AQPotencyAQNEXTAQOAQFEP
ADME and Synthesis
AQADMEmed chem
Make and Test
CRO or client lab
Learn and Decide
Scorecard
Inspect and reproduce our public code and models for free-energy calculation, antibody design, structure prediction and generative design.

Code for stabilizing binding free-energy calculations with nonequilibrium chimeric switching.
Code accompanying our antibody design publication.
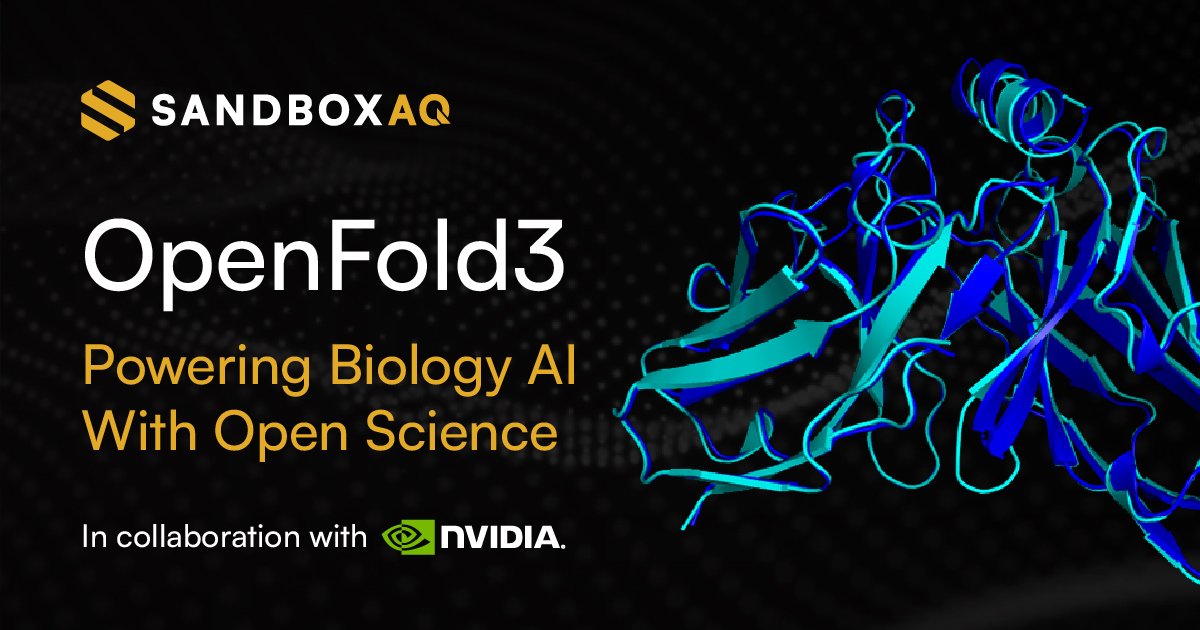
Fully open-source cofolding AI that predicts how drug molecules and proteins fit together.
Guided generative AI that designs drug-like molecules directly in a protein’s binding pocket.
Companion scoring code for IDOLpro.
We aim to catch non-response and liver risk before the clinic. Two of the costliest surprises in drug development are patients who do not respond and drugs that harm the liver. AQCell, our virtual cell model, assesses cell-level effects such as liver injury risk and shows the biology behind them. Our knowledge graph can link what a drug binds to the markers that separate responders from non-responders.
Among 462 medicines withdrawn after approval between 1953 and 2013, hepatotoxicity was the most common reason. Our model, AQCell, is designed to predict liver injury risk from a compound’s structure and dose at the first screening stage, early enough for chemists to redesign the molecule using the corresponding transcriptomic profile.
A risk score alone gives a chemist little to act on. AQCell is designed to show the gene-expression and pathway changes behind each prediction across a dose range, so chemists, biologists and toxicologists read the same explanation and agree on what to change.
We can ingest retrospective Phase 2 patient data, transcriptomics and blood markers to find what separates responders from non-responders, then trace the biological cascades behind non-response. The resulting blood-measurable markers inform inclusion and exclusion criteria for Phase 3.
Fine-tune AQCell on a team’s own organoid or primary-cell data inside that team’s own environment, so raw data never leaves it.
AQCell
AQCell is designed as a virtual cell model that works from a compound’s structure and dose. AQCell is designed to flag liver injury risk at the first screening stage and show the pathway-level biology behind the risk. Designed so teams can see the reasoning behind each prediction.
Our scientists build a knowledge graph around your disease focus and deliver prioritized hypotheses or dossiers with ranked biomarkers and their evidence. In addition, our knowledge graph will include: a versioned graph and source manifest and a cited natural-language interface.
Our Parkinson’s graph joins 15 public databases with proteomic, transcriptomic, clinical and GWAS data into 222,000 nodes and 6.7 million edges, and it recovers known Parkinson’s targets. A graph ranks hypotheses; laboratory experiments confirm them.
Deliverables
Typical length 8 weeks to 6 months
Knowledge Graph Workflow for Pre-Clinical Biomarkers
Ingest
AQKnowledgeGraph
Optimize
Graph curation
Benchmark
Known targets
LLM Interface
Natural Language Q&A
Deploy
Client environment
Prioritized Hypotheses
Dossiers
Our scientists can build a custom knowledge graph around your domain focus and apply our graph-based and ML-based methods to rank targets and biomarkers of interest. The graph provides detailed provenance surrounding every biological relationship, such as the source paper or database. Each engagement ends with ranked hypotheses for your team to test.
Each connection in the graph carries a record of its source. Your team can follow a prioritized gene through its reactions and pathways to the biology behind its score. That lets scientists inspect the reasoning instead of accepting a ranking on trust.
Our graph-RAG technology allows you to ask questions and receive answers in plain language. Each answer cites the graph path and sources behind it. Your scientists do not need to write database queries. They can check any answer against its sources before acting on it.
Genetics, gene expression, proteomic and clinical data often sit in separate silos. Our scientists join them with your own data through careful curation, built around your disease focus. This gives your team a single place to query across every data layer at once and uncover evidence faster.
Start with one question and a small graph. We select priority sources from your data and from public databases, build a graph around your question, such as which targets or biomarkers deserve a closer look in your disease, and benchmark the ranking against known targets or biomarkers where they exist. Our scientists review the results with your team and recommend whether to expand. The pilot gives you a working answer to one question, with the evidence behind each ranked item, before you commit to a full program graph.
Deliverables
Typical length 4 to 6 weeks
Knowledge Graph Workflow
Ingest
AQKnowledgeGraph
Optimize
Graph curation
Benchmark
Known targets
LLM Interface
Natural Language Q&A
Deploy
Client environment
Prioritized Hypotheses
Dossiers
We build a versioned knowledge graph for one disease or program domain from a bounded set of sources. Our scientists ingest your data and public databases, curate the graph by removing duplicates and filling gaps, and benchmark the ranking against known targets or biomarkers.
Your team receives prioritized hypotheses as dossiers that list each ranked target or biomarker with its evidence. Our knowledge graphs are designed to power a cited natural-language query interface, so your scientists follow each answer to its sources. Each stage ends in a go/no-go decision.
Deliverables
Typical length 8 to 12 weeks
Knowledge Graph Workflow
Ingest
AQKnowledgeGraph
Optimize
Graph curation
Benchmark
Known targets
LLM Interface
Natural Language Q&A
Deploy
Client environment
Prioritized Hypotheses
Dossiers
We extend the program graph across several source sets, including your omics data, and deploy it in your environment with an API or user interface, access controls and refresh. Our scientists and engineers hand over the versioned graph and deployment documentation, so your team runs and updates it. Teams that need the graph inside their own infrastructure choose this package. AQKG is designed to automate graph assembly as your sources grow, and each stage ends in a go/no-go decision.
Deliverables
Typical length 4 to 6 months
Knowledge Graph Workflow
Ingest
AQKnowledgeGraph
Optimize
Graph curation
Benchmark
Known targets
LLM Interface
Natural Language Q&A
Deploy
Client environment
Prioritized Hypotheses
Dossiers
We help oncology teams make the early decisions that determine whether a program succeeds in the clinic: which targets and biomarkers to pursue, which small molecules and molecular glues to buy or make, and which antigens to include in a vaccine cargo. Oncology programs lose more candidates in the clinic than the industry average. In a BIO 2011–2020 analysis, they advanced from Phase II to Phase III 24.6% of the time, against 28.9% across all therapeutic areas. Our scientists and Large Quantitative Models rank the options for each decision and are designed to show how far to trust each ranking. Each engagement delivers a decision your team can act on, such as a buy/make list, a ranked target list or a proposed vaccine cargo.
We help oncology teams choose targets and biomarkers with evidence they can audit, because those early choices shape how a program performs in the clinic. In observational data, Phase III programs that used selection biomarkers advanced 76.5% of the time, against 55.0% for those that did not. Our knowledge graph unifies published literature and your own data, with the source behind every link, and every answer traces back to graph paths and source papers. We built a Parkinson’s disease specific graph called PD-KG (222,000 nodes, 6.7 million edges)and applied network-based target prioritization to rank known and novel Parkinson’s targets,a result of which highly ranked well-studied clinical targets including UCHL1 (first), SNCA (fourth), LRRK2 (seventh). AQCell, our virtual cell model, is designed to predict changes in gene expression, pathways and cell viability, extend to tumor cell viability through fine-tuning on your own data, and propose further biomarker candidates. We plan to build the same evidence trail around your tumor type, so your team can separate causal targets from correlated ones.
We help oncology teams rank small molecules and molecular glues computationally, so chemists spend their effort on the strongest candidates. Our structure-free models rank a compound library from a UniProt ID and SMILES strings, and they score kinase selectivity panels in the same pass, so off-target risks surface before synthesis. Our hit-finding work covers oncology targets that include prostate cancer and kinases. For scaffold hops, NEX keeps free-energy calculations stable by routing each through an intermediate that blends both ligands. On CDK2, a cell-cycle kinase studied as a cancer target, NEX cut failed transformations from 16% to 2% or below at equal compute. For molecular glues, we rank the ternary complex first, because binary affinity says little about a glue. Your chemists reach the bench with a ranked shortlist and a clear view of the risks.
Sources:
Pitman M., Sood A., Rufa D., Huntington L., "Nonequilibrium Chimeric Switching (NEX) Stabilizes Binding Free Energy Calculations," ChemRxiv (2026)House I. et al., "Cyclin Dependent Kinase 2 (CDK2) Inhibitors in Oncology Clinical Trials: A Review," Journal of Immunotherapy and Precision Oncology 8(1):47–54 (2025)We help oncology teams build a vaccine cargo that balances HLA coverage, expression and antigen diversity, starting from tumor DNA, RNA and HLA data. A ranked list of predicted MHC binders is only a starting point, because the cargo has to satisfy all three. Our pipeline is designed to check tumor, normal and HLA data, call variants, and find neoantigens, tumor-associated antigens and gene fusions. It then ranks epitopes by HLA presentation and selects a multi-antigen cargo. We apply this approach in our collaboration with iOncologi on an mRNA vaccine for glioblastoma. We plan to hand your team a reproducible run, so the same pipeline can repeat for new cohorts or indications.
Fine-tune AQCell on your own organoid or primary-cell data (including tumor cell data) inside your own environment, so raw data never leaves.
AQCell
AQCell is a virtual cell model that works from a compound’s structure and dose.
A better order beats a bigger library. Our models rank a library without a structure and score kinase selectivity panels in the same pass, we re-rank the shortlist with physics only where physics adds signal, and our medicinal chemists review every list before it ships. We plan to attach early ADME flags with an uncertainty estimate, so the assay budget goes to compounds worth testing. Our hit-finding capabilities cover oncology disease areas that include prostate cancer and kinase targets.
Deliverables
Typical length 8–12 weeks
Hit-Finding Campaign Workflow: target to ranked buy/make list
Scope and Baseline
Target, assay, budget
Generate or Screen
AQGenlibrary screen
Potency Triage
AQPotency
Physics Re-rank
AQFEPTAQOAQNEX
ADME Flags
AQADME
Buy/Make List
Med-chem review
The best next compound often has no close relative to compare it with. Free-energy methods rank close analogs well but cost too much to run on everything, and fast scorers that run on everything still trail them at that job, although they run about 400,000 times faster. We chain the two: fast models triage every analog the chemists propose, score the kinase selectivity panel, and physics re-ranks the shortlist.
For scaffold hops, we are previewing NEX, our nonequilibrium chimeric switching method. At equal compute on a CDK2 test, direct switching failed on 16% of transformations; with NEX, failures fell to 2% or below. We plan to bring that stability to every series we run.
Deliverables
Typical length 4–6 months, across several design cycles
DMTA Optimization Workflow
Ingest Assay Data
Client or CRO data
Design
AQGenenumeration
Rank
AQPotencyAQNEXTAQOAQFEP
ADME and Synthesis
AQADMEmed chem
Make and Test
CRO or client lab
Learn and Decide
Scorecard
Binary affinity says little about a molecular glue, which works through the complex it forms with a target and an E3 ligase. We rank the complexes first and start optimization only after the pilot passes. An experimental partner validates the top hypotheses.
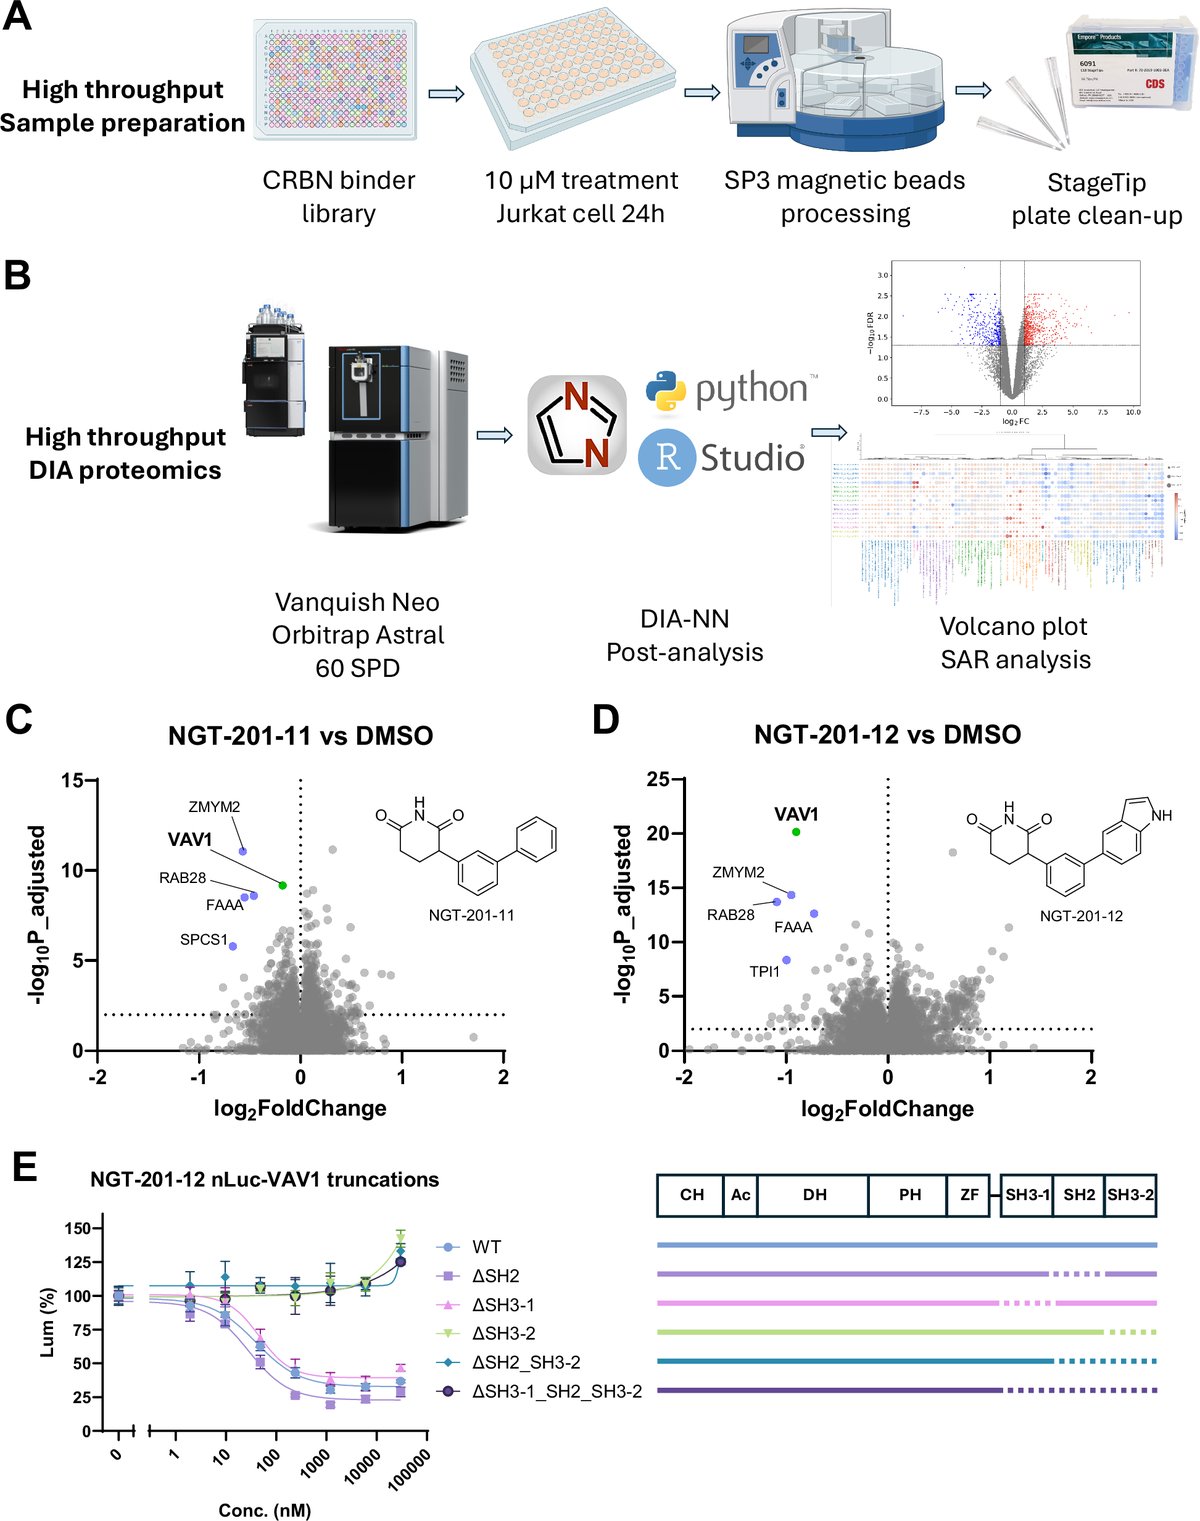
Public work shows why the order matters. In a published VAV1 glue study with an academic collaborator, a standalone co-folding model failed to assemble a new type of ligase–target interface, while a workflow that added physics-based restraints succeeded.
Deliverables
Molecular-Glue Workflow: rank ternary complexes first
Complex Modeling
Co-foldingdocking
Dynamics
Mixed-solvent MD
Complex Ranking
AQDegrader
Cooperativity
AQFEPTAQO
Ranked Hypotheses
Validation plan
Our scientists build a knowledge graph around your tumor type that joins public databases with your proteomic, transcriptomic, clinical and genomic data, and they rank targets and biomarkers with the evidence behind each one.
Our Parkinson’s graph joins 15 public databases into 222,000 nodes and 6.7 million edges, and it recovers known Parkinson’s targets. AQKG is designed to bring the same method to oncology. A graph ranks hypotheses; laboratory experiments confirm them.
Deliverables
Typical length 8 weeks to 6 months
Knowledge Graph Workflow
Ingest
AQKnowledgeGraph
Optimize
Graph curation
Benchmark
Known targets
LLM Interface
Natural Language Q&A
Deploy
Client environment
Prioritized Hypotheses
Dossiers
A ranked list of predicted MHC binders is a starting point for a vaccine, and the cargo still has to balance HLA coverage, expression and antigen diversity. Our antigen discovery pipeline is designed to take tumor DNA, RNA and HLA data through quality control, variant calling and antigen discovery, covering neoantigens, tumor-associated antigens and gene fusions, then rank epitopes by HLA presentation and select a multi-antigen cargo. We plan to hand back a reproducible run that repeats for new cohorts. Glioblastoma, pediatric brain tumors and heterogeneous solid tumors are the disease areas in scope.
Deliverables
Typical size 8–12 weeks for one indication or cohort
Cancer-Vaccine Cargo Design Workflow: tumor data to ranked cargo
Data QC
Tumor DNA/RNA, HLA
Variant Calling
Luminos
Antigen Discovery
Luminos
Immunogenicity Ranking
HLA-aware
Cargo Selection
Multi-antigen
Proposed Cargo
Validation plan
We sell decisions and the outcomes they enable. Each Frontier Science Service answers one decision, from which target to pursue to which compound to make next, and brings the workflow behind it: our models, physics-based methods, scientists and a go/no-go gate.
A dedicated biopharma core of 70+ specialists runs each engagement. Every one ends with a decision and a deliverable: a buy/make list, a next-round compound set, a ranked target list, a proposed vaccine cargo or a recommended workflow.
Each engagement leaves a reusable workflow, a record of every run, and a model-versus-experiment scorecard that shows how far to trust each prediction.
A program that stops at one of our gates costs less than one that stops in the clinic and allows teams to refocus their energy and resources on new approaches.
A better order beats a bigger library. Our models rank a library without a crystal structure, we re-rank the shortlist with physics only where physics adds signal, and our medicinal chemists review every list before it ships. We aim to attach early ADME flags with an uncertainty estimate, so the assay budget goes to compounds worth testing. We have run this for neurodegeneration and GPCR targets.
Deliverables
Typical length 8–12 weeks
Hit-Finding Campaign Workflow: target to ranked buy/make list
Scope and Baseline
Target, assay, budget
Generate or Screen
AQGenlibrary screen
Potency Triage
AQPotency
Physics Re-rank
AQFEPTAQOAQNEX
ADME Flags
AQADME
Buy/Make List
Med-chem review
The best next compound often has no close relative to compare it with. Free-energy methods rank close analogs well but cost too much to run on everything, and fast scorers that run on everything still trail them at that job, although they run about 400,000 times faster. We chain the two: fast models triage every analog the chemists propose, and physics re-ranks the shortlist.
For scaffold hops, we are previewing NEX, our nonequilibrium chimeric switching method. At equal compute on a CDK2 test, direct switching failed on 16% of transformations; with NEX, failures fell to 2% or below. On a 45-transformation BACE1 scaffold-hopping set run without manual tuning, NEX reached r = 0.71 against experiment. We aim to bring that stability to every series we run.
Deliverables
Typical length 4–6 months, across several design cycles
DMTA Optimization Workflow
Ingest Assay Data
Client or CRO data
Design
AQGenenumeration
Rank
AQPotencyAQNEXTAQOAQFEP
ADME and Synthesis
AQADMEmed chem
Make and Test
CRO or client lab
Learn and Decide
Scorecard
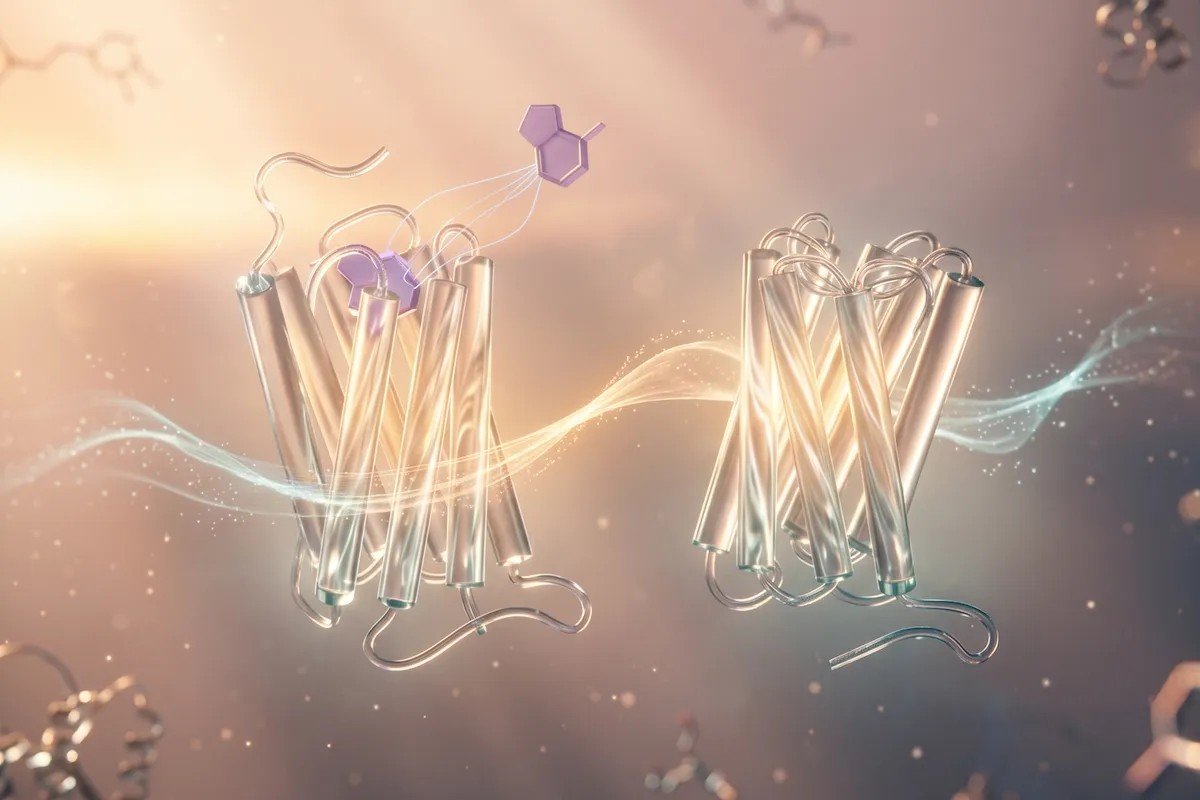
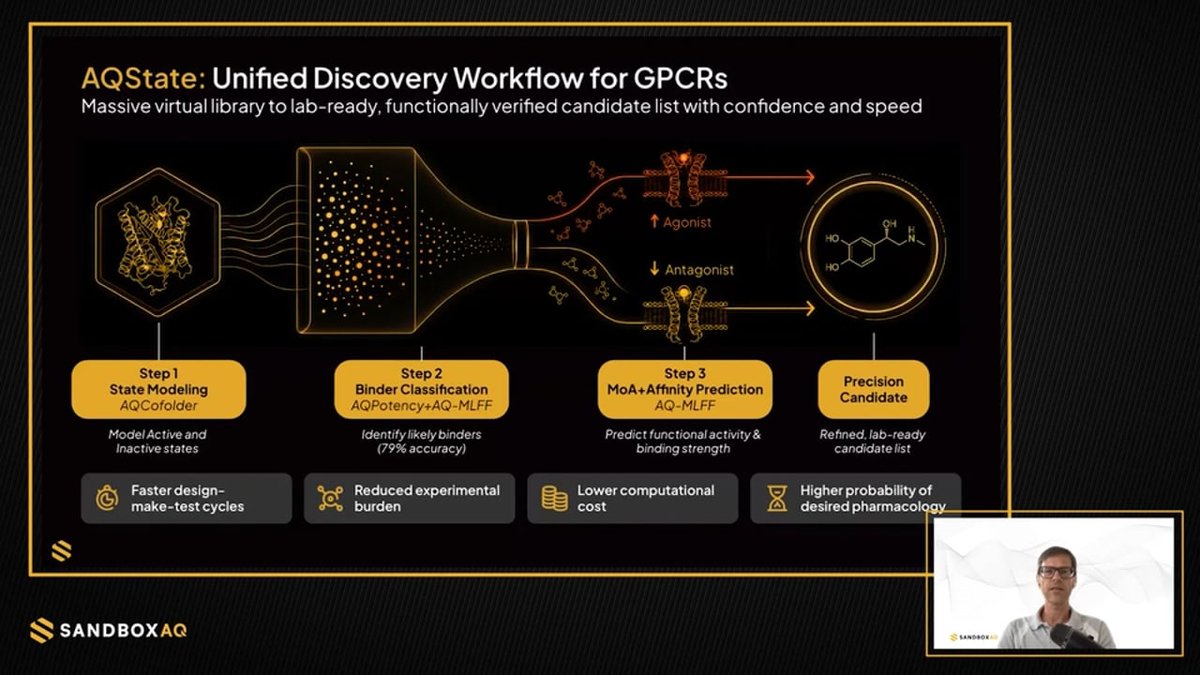
Two compounds can bind a GPCR equally well and do opposite things: one switches the receptor on, the other blocks it. Our add-on models the receptor’s active and inactive states and classifies likely binders and predicts agonist or antagonist behavior for each compound.
Deliverables
GPCR State Add-on Workflow
State Modeling
AQCofolder
Binder Classification
AQPotency
MoA and Affinity
AQPotencyMoAAQFEPTAQO
Target Benchmark
Known ligands
Precision Candidates
AQState
Binary affinity says little about a molecular glue, which works through the complex it forms with a target and an E3 ligase. We rank the complexes first and start optimization only after the pilot passes.
Public work shows why the order matters. In a published VAV1 glue study with an academic collaborator, a standalone co-folding model failed to assemble a new type of ligase–target interface, while a workflow that added physics-based restraints succeeded.
Deliverables
Molecular-Glue Workflow: rank ternary complexes first
Complex Modeling
Co-foldingdocking
Dynamics
Mixed-solvent MD
Complex Ranking
AQDegrader
Cooperativity
AQFEPTAQO
Ranked Hypotheses
Validation plan
Our Parkinson’s graph joins 15 public databases with proteomic, transcriptomic, clinical and GWAS data into 222,000 nodes and 6.7 million edges, and it recovers known Parkinson’s targets. A graph ranks hypotheses; laboratory experiments confirm them.
Deliverables
Typical length 8 weeks to 6 months
Knowledge Graph Workflow
Ingest
AQKnowledgeGraph
Optimize
Graph curation
Benchmark
Known targets
LLM Interface
Natural Language Q&A
Deploy
Client environment
Prioritized Hypotheses
Dossiers
A ranked list of predicted MHC binders is a starting point for a vaccine, and the cargo still has to balance HLA coverage, expression and antigen diversity. Our intent is to take tumor DNA, RNA and HLA data through quality control, variant calling and antigen discovery, covering neoantigens, tumor-associated antigens and gene fusions, then rank epitopes by HLA presentation and select a multi-antigen cargo. We aim to hand back a reproducible run that repeats for new cohorts.
Deliverables
Typical size 8–12 weeks for one indication or cohort
Cancer-Vaccine Cargo Design Workflow: tumor data to ranked cargo
Data QC
Tumor DNA/RNA, HLA
Variant Calling
Luminos
Antigen Discovery
Luminos
Immunogenicity Ranking
HLA-aware
Cargo Selection
Multi-antigen
Proposed Cargo
Validation plan
More modeling does not always make better antibodies, so we add each layer only when it earns its place. We start with language models trained on the program’s own sequences and assays, add structure for a qualified subset, and add physics only where it moves the ranking, then benchmark each step against held-out and new assays.
Public work explains the caution. In our June 2026 preprint, co-folding failures came mostly from where the model placed the antigen, and the antibody’s own fold contributed less. We aim to recommend the leanest workflow that reaches the program’s targets, and we deploy it in our partner’s cloud or on-prem.
Deliverables
Typical size 8–12 weeks per design cycle
Antibody Design Cycles: leanest workflow that works
Train PLMs
AQPLM
Generate and Score
AQPLM
Structure
AQCofolder
Physics
AQFEPAQNEX
Benchmark
Held-out and new assays
Optimal Workflow
Deploy
Proven design capabilities in ultra-low-data regimes.
Large Quantitative Models (LQMs) learn directly from quantitative data grounded in first principles rather than the language patterns used to train standard LLMs. Where prediction alone is not enough, we add physics-based simulation. We build our models to say how far to trust each prediction.
Public databases are sparse, uneven and inconsistent. We generate training data with physics-based methods (quantum chemistry, molecular dynamics and free-energy simulation) so that labels come from one consistent method, and we pair it with experimental data where it exists.
Models trained on physics-based and experimental data predict molecular and electronic behavior at screening speed, without running a simulation for every candidate.
Our intent is for agentic workflows to run iterative design–make–test–analyze cycles, with domain experts approving at critical checkpoints. Each result arrives with its uncertainty and evidence trail, so a decision can be defended.